


Matlab is a widely used numerical computation environment. It is easy to make plots in Matlab, which can be exported to vector format (PDF/EPS) for implementation in LaTeX. The problem is that the default Matlab plots do not fit very well in the style of LaTeX, due to the different font and font size of the text in the Matlab plots. My favorite way of creating Matlab figures with LaTeX fonts is by making use of the matlab2tikz script. On my website, I’ve already described how to use this. In general this method works great, although some flaws exist. In this post, I’ll list the most frequent problems I encounter with matlab2tikz. I’ll also describe how I solve these problems. Do not expect superefficient routines, I’ll only give the commands that are not exported to TikZ when converting a Matlab plot with matlab2tikz.
General command in Matlab
This is the red thread of this article. Exporting any figure is done with the following Matlab command:
matlab2tikz( 'MyFig.tikz', 'height', '\fheight', 'width', '\fwidth');
Subplots
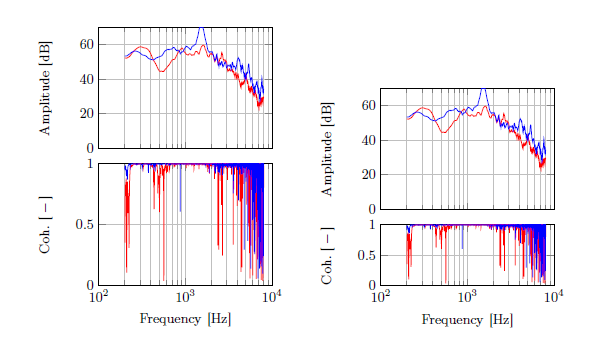
When creating several plots in one figure, underneath or next to each other, the conversion with matlab2tikz makes all subplots of the same size. I’m working a lot with Bode plots: plots where a magnitude and a phase curve are plotted separately. I find it pretty too have the phase subplot half the height of the magnitude plot. The problem with matlab2tikz conversion is that you can specify only one height (and one width); all subplots will be sized to this height.
Assuming you have a figure with two subplots underneath each other, the exported TikZ file will have to axis environments, with specified heights:
height=\fheight
The solution is to find the second height (corresponding to the second axis enviroment), and change it like this:
height=0.5\fheight
Before and after:
Axis ticks and ticklabels
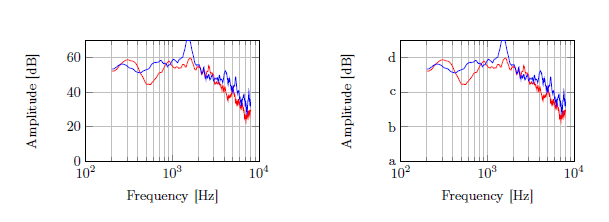
The following problem comes more from the TikZ/pgfplots side. When the plotting range (e.g. the minimal and maximal value along the vertical axis) is too large, TikZ will leave out some axis ticks. This on its turn affects the grid (if any) in your figure. To specifiy custom ticks along the vertical axis (y axis), add the following to the axis environment:
ytick={1,2,3,4}
This will only create axis entries (ticks) at the values 1 to 4. In order to rename the defined ticks, use the yticklabels command:
yticklabels={a,b,c,d}
Like this, the tick ‘1’ will be replaced by ‘a’, ‘2’ by ‘b’, etc.
Before and after:
Legends
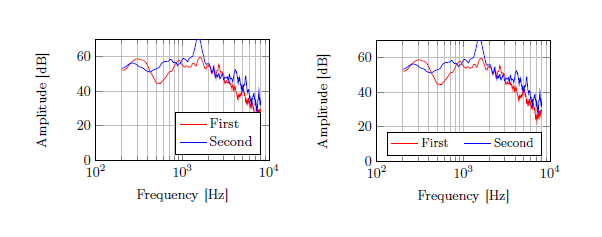
I often find it convenient to have the legend entries all in one line (i.e. a horizontal legend, rather than vertical). In order to do this, add the following to the [code]axis[/code] environment:
legend columns=-1
This needs to be placed before the legend entries={} command. In order to enlarge the space between the horizontal legend entries a bit, add this:
legend style={/tikz/every even column/.append style={column sep=0.3cm}}
Lastly, too save space I change the font size of my legend to \footnotesize. This is done as follows:
legend style={font=\footnotesize}
Before and after:
About the Author:Frits is a MSc student Mechanical Engineering in Delft, the Netherlands. During the BSc period of his study, he started to learn LaTeX. Soon he got hooked to this way of typesetting documents. As he was one of the few BSc students that used LaTeX, people asked him to teach them how to use LaTeX. This gave him the idea of setting up a blog. The website howToTeX.com is aimed for LaTeX beginners and is filled with tips, tricks and templates. He also is co-author of the ‘five minute guide to LaTeX’. Once in a while, he writes about more advanced topics like his guide to improve LaTeX productivity.